Statistics is the subject that makes data analysts genuinely powerful — and it is also the subject that trips up the most candidates in technical interviews. The statistics interview questions for data analysts in India in 2026 asked at companies like Amazon, Flipkart, and PhonePe and consulting firms are not obscure textbook problems. They test whether you understand the fundamental concepts clearly enough to explain them simply and apply them correctly to real business scenarios.
This guide covers every important statistics interview question for data analysts in India in 2026 — from descriptive statistics basics to hypothesis testing, probability distributions, A/B testing, and regression — with clear explanations, Indian business examples, and interview-ready answers that will help you stand out in any round.
Why Statistics Is the Most Differentiating Skill in Indian Data Analyst Interviews 2026
Many candidates can write SQL queries and run Python code. Far fewer can clearly explain why a p-value of 0.03 does not mean there is a 97% chance the result is real or when to use a t-test versus a chi-square test.
The statistics interview questions for data analysts in India in 2026 that separate shortlisted candidates from hired ones test conceptual understanding—not just memorized definitions. Interviewers at product companies want to know if you can:
- Interpret statistical results correctly and communicate them to non-technical stakeholders
- Design experiments that produce valid, reliable conclusions
- Distinguish correlation from causation and statistical significance from practical significance
- Apply the right statistical test for each type of data and business question
Section 1 — Descriptive Statistics (Foundation Level)
These statistics interview questions for data analysts in India in 2026 appear in every interview regardless of company type or seniority level.
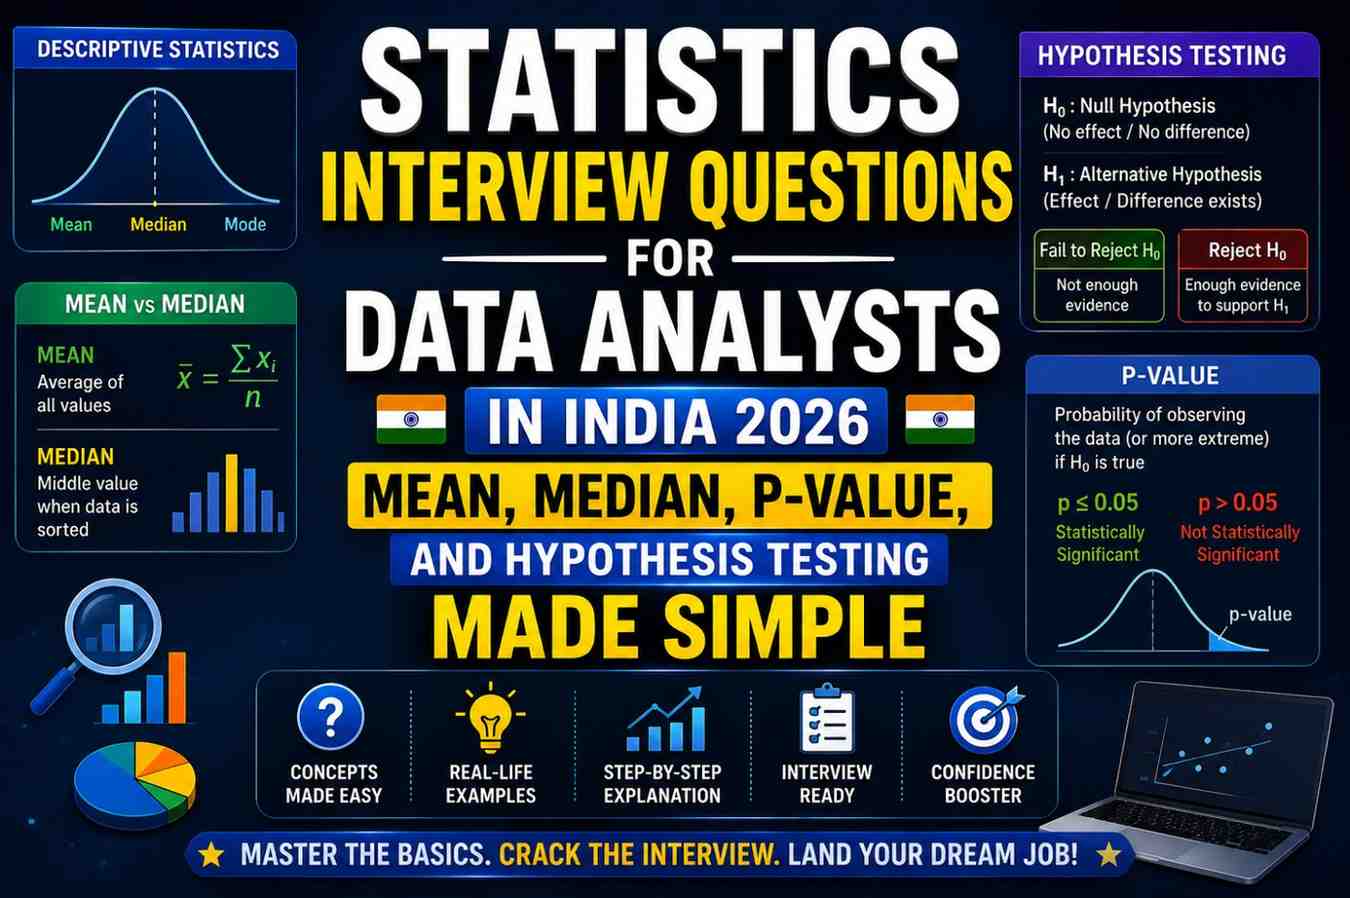
Q1. What is the difference between mean, median, and mode? When would you use each in a business context?
Answer:
- Mean (average) — sum of all values divided by count. Use when data is approximately normally distributed and has no extreme outliers.
- Median — middle value when data is sorted. Use when data has outliers or is skewed. The median is a more honest central tendency measure for real-world data.
- Mode — most frequent value. Use for categorical data or to find the most common occurrence.
Indian business example:
When reporting average salary at a tech company in Bengaluru, the mean is distorted upward by a few senior executives earning ₹2–3 crore. The median salary of ₹12 LPA gives a far more accurate picture of what a typical employee earns. This is why statistics interview questions for data analysts in India in 2026 almost always test this distinction in a business context.
Q2. What are variance and standard deviation? Why does standard deviation matter more in practice?
Answer:
- Variance — average of squared deviations from the mean. In the same squared units as the data — harder to interpret intuitively.
- Standard deviation (SD) — square root of variance. In the same units as the original data, it’s much easier to interpret.
Formula: SD = √(Σ(xi – x̄)² / n)
Business example: If average delivery time for Swiggy is 28 minutes with an SD of 3 minutes, most orders arrive between 25–31 minutes—very consistent. If SD is 15 minutes, customers experience wildly inconsistent delivery times — a major UX and trust problem. Standard deviation is one of the most practical and frequently used concepts in statistics interview questions for data analysts in India in 2026.
Q3. What is skewness? How does it affect which measure of central tendency you should use?
Answer: Skewness measures the asymmetry of a distribution.
- Positively skewed (right skew) — tail extends to the right; mean > median > mode. Common in income, house prices, and order value data.
- Negatively skewed (left skew) — tail extends to the left; mean < median < mode. Less common.
- Symmetric—mean ≈ median ≈ mode. Approximately normal distribution.
Rule: In skewed data, always use the median as your central tendency measure. In symmetric data, mean works well. This is a foundational statistics interview question for data analysts in India in 2026 that trips up many candidates who mechanically report mean without checking distribution shape first.
Q4. What is the difference between population and sample?
Answer:
- Population — the entire group you want to draw conclusions about (e.g., all Flipkart customers in India)
- Sample — a subset of the population you actually measure (e.g., 10,000 randomly selected Flipkart customers)
In data analytics, we almost always work with samples and use statistical inference to draw conclusions about the population. The key requirement is that the sample must be representative — randomly selected without systematic bias.
Why it matters in interviews: Understanding population vs. sample is the conceptual foundation for all hypothesis testing and A/B testing questions in statistics interview questions for data analysts in India in 2026.
Q5. What is an outlier? How do you detect and handle it?
Answer: An outlier is a data point that lies unusually far from the rest of the distribution.
Detection methods:
- IQR method: outliers are values below Q1 – 1.5×IQR or above Q3 + 1.5×IQR
- Z-score method: outliers have |z-score| > 3 (more than 3 standard deviations from the mean)
- Visualisation: box plots and scatter plots reveal outliers visually
Handling strategies:
- Investigate first — is it a data entry error or a real extreme value?
- If genuine: use robust statistics (median, IQR instead of mean and SD), or use models that handle outliers well
- If there is an error: correct or remove the value with documentation
Automatically removing outliers without investigation is a common mistake that interviewers probe for in statistics interview questions for data analysts in India in 2026.
Section 2 — Probability Basics
Q6. What is the difference between independent and mutually exclusive events?
Answer:
- Independent events — the outcome of one does not affect the probability of the other. Example: flipping a coin twice — getting heads on the first flip does not affect the second flip.
- Mutually exclusive events — if one occurs, the other cannot. Example: A customer either churns or stays in a given month—both cannot be true simultaneously.
These are frequently confused in statistics interview questions for data analysts in India in 2026. Independent events can both occur simultaneously; mutually exclusive events cannot.
Q7. What is Bayes’ Theorem, and give a practical example from Indian business?
Answer: Bayes’ Theorem calculates conditional probability — the probability of an event given that another event has already occurred.
Formula: P(A|B) = P(B|A) × P(A) / P(B)
Indian example (spam email filter at an Indian bank):
- 2% of all emails are spam: P(Spam) = 0.02
- If an email is spam, the word “lottery” appears 70% of the time: P(lottery|spam) = 0.70
- The word “lottery” appears in 5% of all emails: P(lottery) = 0.05
P(spam|lottery) = (0.70 × 0.02) / 0.05 = 0.28, or 28%
If an email contains “lottery,” there is a 28% chance it is spam — not 70%. Bayes’ Theorem appears regularly in advanced statistics interview questions for data analyst India 2026 at BFSI and fraud analytics roles.
Also Read: https://dscareers.site/sql-interview-questions-for-data-analysts/
Section 3 — Hypothesis Testing (Most Important Section)
Hypothesis testing is the most heavily tested category in statistics interview questions for data analysts in India in 2026 at product companies and analytics consulting firms.
Q8. What is hypothesis testing? Explain the complete process step by step.
Answer:
Hypothesis testing is a formal procedure to determine whether observed data provides enough evidence to reject a default assumption (the null hypothesis).
Step-by-step process:
- Define the null hypothesis (H₀) — the default assumption. Example: “The new website design does not improve conversion rate.”
- Define the alternative hypothesis (H₁) — what you want to prove. Example: “The new website design improves conversion rate.”
- Choose significance level (α) — the threshold for rejecting H₀. Standard is α = 0.05.
- Choose the right statistical test based on data type and sample size.
- Calculate the test statistic—a number that summarizes how far your sample is from H₀.
- Calculate the p-value — the probability of observing results this extreme if H₀ were true.
- Make a decision:
- If p-value < α → Reject H₀ (result is statistically significant)
- If p-value ≥ α → Fail to reject H₀ (not enough evidence)
- Communicate the business conclusion — not just the statistical result.
This complete process is the most important single answer in all statistics interview questions for data analysts in India 2026.
Q9. What is a p-value? What does it actually mean?
Answer: A p-value is the probability of observing a test result as extreme as the one calculated from your sample data, assuming the null hypothesis is true.
What it is NOT:
- It is NOT the probability that the null hypothesis is true
- It is NOT the probability that your result occurred by chance
- A p-value of 0.03 does NOT mean there is a 97% chance the result is real
What it IS: A small p-value (< 0.05) means, “If the null hypothesis were true, we would observe a result this extreme only 3% of the time by random chance. This is unlikely enough that we reject the null hypothesis.”
This conceptual nuance separates strong candidates in statistics interview questions for data analysts in India in 2026 from those who have memorized a definition without truly understanding it.
Q10. What is the difference between a Type I error and a Type II error?
Answer:
| Reality: H₀ True | Reality: H₀ False | |
|---|---|---|
| Test: Reject H₀ | Type I Error (False Positive) | Correct Decision ✓ |
| Test: Fail to Reject H₀ | Correct Decision ✓ | Type II Error (False Negative) |
- Type I Error (α) — False positive. Concluded there is an effect when there is none. In medicine: declaring an ineffective drug effective. In business: rolling out a new feature that actually does not help.
- Type II Error (β) — False negative. Missed a real effect. In business: abandoning a genuinely better product design because the test was underpowered.
Business context: At an Indian e-commerce company, Type I error wastes engineering resources. A Type II error means missing a real revenue improvement opportunity. The cost of each determines which error threshold (α) to set—a nuanced point that impresses interviewers in statistics interview questions for data analysts in India in 2026.
Q11. What is a confidence interval? How do you interpret a 95% CI of [3.2%, 6.8%]?
Answer: A 95% confidence interval means “If we repeated this experiment 100 times, 95 of those times the calculated confidence interval would contain the true population parameter.”
For a CI of [3.2%, 6.8%] on conversion rate improvement:
- We are 95% confident the true improvement in conversion rate is somewhere between 3.2% and 6.8%
- The entire interval is above zero—strong evidence of a positive effect
- The width (3.6%) represents the precision of our estimate—a narrower CI would require a larger sample size
Common misconception: It does NOT mean “there is a 95% probability that the true value is in this specific interval. ” The true value either is in the interval or is not—it is the process that has 95% coverage.
Q12. When do you use a t-test vs. a z-test?
Answer:
- Z-test — use when sample size is large (n > 30) and population standard deviation is known
- T-test—use when sample size is small (n < 30) or population standard deviation is unknown (more common in practice)
In reality, the t-test is used for almost all practical hypothesis testing in statistics interview questions for data analyst India 2026 contexts because population SD is almost never known. The t-distribution converges to the z-distribution as sample size increases.
Q13. What is the difference between a one-tailed and a two-tailed test?
Answer:
- Two-tailed test — tests if the result is significantly different in either direction (higher or lower). Use when you have no prior expectation about the direction of the effect.
- One-tailed test — tests if the result is significantly different in one specific direction only (e.g., only checking if conversion rate increased, not decreased). Use when business theory strongly predicts the direction.
Recommendation for most A/B tests: Use two-tailed tests. They are more conservative and reduce the risk of false positives—a key principle in statistics interview questions for data analyst India 2026 A/B testing design.
Q14. When do you use a chi-square test?
Answer: Use a chi-square test when you are testing whether there is a significant association between two categorical variables.
Examples:
- Does email open rate differ significantly between Gmail and Outlook users?
- Is there a significant difference in payment method preference across age groups?
- Does conversion rate differ significantly between the control and treatment groups in an A/B test where the outcome is binary (converted: yes/no)?
python
from scipy.stats import chi2_contingency

contingency_table = [[150, 850], [200, 800]]  # [converted, not converted] for each group
chi2, p_value, dof, expected = chi2_contingency(contingency_table)
print(f"Chi-square: {chi2:.2f}, p-value: {p_value:.4f}")
Q15. What is statistical power, and why does it matter for A/B testing?
Answer: Statistical power (1 – β) is the probability of correctly detecting a real effect when one exists. Standard target: 80% power.
Why it matters for A/B tests:
- Low power = high chance of missing a real improvement (Type II error)
- Before running an A/B test, calculate the required sample size to achieve 80% power for your expected effect size at α = 0.05
- If you stop a test early (peeking problem), you inflate Type I error and reduce power simultaneously
Section 4 — Regression and Correlation
Q16. What is the difference between correlation and regression?
Answer:
- Correlation — measures the strength and direction of the linear relationship between two variables. Output is Pearson’s r, ranging from -1 to +1. Does not imply causation.
- Regression — builds a model to predict one variable from one or more others. Produces a mathematical equation (y = mx + b) that can be used for prediction and understanding variable impact.
Key difference: Correlation describes a relationship. Regression models it for prediction or causal inference.
Q17. What are the key assumptions of linear regression?
Answer: The five key assumptions tested in advanced statistics interview questions for data analysts in India 2026:
- Linearity — the relationship between X and Y is linear
- Independence — observations are independent of each other
- Homoscedasticity — variance of residuals is constant across all fitted values
- Normality of residuals — residuals are normally distributed
- No multicollinearity — predictor variables are not highly correlated with each other
Violations of these assumptions do not always break the model—but knowing them shows the interviewer you understand when to trust your regression outputs.
Q18. What is R-squared, and what does it tell you?
Answer: R-squared measures the proportion of variance in the dependent variable explained by the independent variables in a regression model. Range: 0 to 1 (or 0% to 100%).
- R² = 0.75 means the model explains 75% of the variation in the target variable
- Higher R² is generally better, but a very high R² (> 0.99) in social science or business data often indicates overfitting or data leakage
Limitation: R² always increases when you add more variables, even useless ones. Use adjusted R², which penalizes for adding irrelevant variables—a distinction that appears in senior statistics interview questions for data analysts in India in 2026.
Quick-Fire Statistics Questions (Final Rounds and Warm-Up)
Q19. What is the Central Limit Theorem? → The distribution of sample means approaches a normal distribution as sample size increases (n > 30), regardless of the population’s original distribution. This is what allows us to use hypothesis tests on real-world data that is rarely perfectly normal.
Q20. What is multicollinearity, and how do you detect it? → When two or more predictor variables in a regression model are highly correlated. Detected using Variance Inflation Factor (VIF). VIF > 10 signals serious multicollinearity. Fix it by removing one of the correlated variables or using regularization (Lasso, Ridge).
Q21. What is the difference between parametric and non-parametric tests? → Parametric tests assume the data follows a specific distribution (usually normal). Nonparametric tests make no distributional assumptions—use them with small samples, ordinal data, or heavily skewed data.
Q22. What is ANOVA? → Analysis of Variance — tests if the means of three or more groups are significantly different. Use when comparing more than two groups (e.g., does conversion rate differ across four different versions of a landing page?).
Q23. What is the difference between absolute risk and relative risk? → Absolute risk: the actual change in probability (from 10% to 12% = 2 percentage points). Relative risk: the proportional change (2%/10% = 20% increase). “Relative risk” sounds more dramatic—be careful which one stakeholders are quoting in business discussions.
Comparison: Statistical Tests by Scenario
| Scenario | Right Test |
|---|---|
| Compare mean of one group to a known value | One-sample t-test |
| Compare means of two independent groups | Independent two-sample t-test |
| Compare means of same group before and after | Paired t-test |
| Compare means of 3+ groups | ANOVA |
| Test association between two categorical variables | Chi-square test |
| Test correlation between two continuous variables | Pearson or Spearman correlation |
| Predict continuous outcome from one variable | Simple linear regression |
| Predict binary outcome (yes/no) | Logistic regression |
Image Suggestions
Image 1—Placement: After the introduction, a clean illustration of a normal distribution bell curve with mean, median, and standard deviation marked on a whiteboard in an Indian tech office setting. ALT text: “statistics interview questions for data analyst India 2026—normal distribution curve with mean, median and standard deviation on whiteboard”
Image 2—Placement: After the hypothesis testing section, a visual diagram showing the hypothesis testing process—H₀, H₁, p-value threshold, and decision tree—in a simple flowchart format. ALT text: “statistics interview questions for data analyst India 2026—hypothesis testing framework with p-value and decision rule diagram”
External Authority Links
- Khan Academy — Statistics and Probability — best free resource for building intuitive stats understanding
- StatQuest with Josh Starmer YouTube — exceptionally clear video explanations of all statistics concepts
- Analytics Vidhya — Statistics for Data Science India — India-focused stats tutorials and interview guides
- Towards Data Science — Statistics Articles — practitioner-level statistics explainers
- SciPy Statistics Documentation — Python implementation of all statistical tests
FAQs: Statistics Interview Questions for Data Analyst India 2026
Q1. How deeply do companies test statistics in data analyst interviews in India? Product companies (Amazon, Flipkart, and Swiggy) and consulting firms test statistics deeply—including hypothesis testing design, A/B test interpretation, and regression assumptions. IT services companies (TCS, Infosys) cover statistics interview questions for data analysts in India in 2026 at a more foundational level for analyst roles.
Q2. Is probability important for statistics interviews in India? Yes—especially Bayes’ Theorem, conditional probability, and basic probability rules appear consistently in statistics interview questions for data analysts in India 2026 at BFSI and fraud analytics companies. For product analytics roles, A/B testing and hypothesis testing are more heavily weighted.
Q3. Do I need to know statistical coding in Python for statistics interview rounds? At technical companies, yes—being able to run a t-test or chi-square test using scipy.stats Python is expected. The statistics interview questions for data analysts in India in 2026 at product companies often include a “How would you code this?” follow-up to any conceptual stats question.
Q4. What is the most common statistics mistake candidates make in Indian data analyst interviews? Confusing statistical significance with practical significance is the most common failure in statistical interview questions for data analyst India 2026. A result can be statistically significant (p < 0.05) but practically meaningless (e.g., a 0.01% conversion rate improvement that does not justify the engineering cost of deploying the change).
Q5. How should I practise statistics for data analyst interviews in India? Watch every StatQuest video on hypothesis testing and regression. Work through Khan Academy’s statistics course. Then apply each concept to an Indian business scenario using the examples in this statistics interview questions for data analyst India 2026 guide. Real application beats passive reading every time.
Conclusion
Statistics is the foundation that makes every other data analyst skill meaningful. SQL extracts data. Python manipulates it. Statistics tells you what the data actually means and whether your conclusions are trustworthy.
Mastering the statistics interview questions for data analyst India 2026 in this guide — from mean and median to hypothesis testing, A/B test design, regression, and Bayesian reasoning — will make you a genuinely stronger analyst, not just a better interviewee.
The candidates who ace statistics interview questions for data analyst India 2026 rounds at India’s top companies are not the ones who memorized the most definitions. They are the ones who can explain a p-value to a business stakeholder in 30 seconds, design an A/B test with the right sample size, and tell the difference between a result that is statistically significant and one that actually matters.
Which statistics concept do you find most confusing? Drop it in the comments and we will break it down with a simple, clear Indian business example just for you!