The case study round is the most feared part of any data science interview — and the most misunderstood. Many technically brilliant candidates fail here not because they lack knowledge, but because they do not know how to structure their thinking under pressure. Understanding data science case study interview questions in India 2026 goes far beyond knowing algorithms or SQL—it requires a clear, confident analytical framework that can be applied to any business problem in five minutes.
This guide gives you the exact framework used by top consultants and analysts at McKinsey, Amazon, Flipkart, and India’s leading data-driven companies—applied specifically to data science case study interview questions in India’s 2026 patterns. You will see the framework applied to 15 real case questions with complete, structured answers.
Why Case Study Rounds Are Now Standard in Indian Data Science Interviews
In 2026, nearly every serious data science role in India — from analytics managers at Flipkart to data scientists at BCG Gamma, from growth analysts at Swiggy to ML engineers at Juspay — includes a case study round. Understanding data science case study interview questions in India in 2026 has become as important as SQL and Python proficiency.
Companies use case studies because they reveal the following:
- How you think when facing incomplete, ambiguous information
- Whether you can translate a business problem into an analytical solution
- How you prioritise under time and resource constraints
- Whether your final recommendation is actionable, not just technically correct
The most common mistake candidates make with data science case study interview questions in India in 2026 is jumping straight to solutions without first establishing what problem is actually being solved.
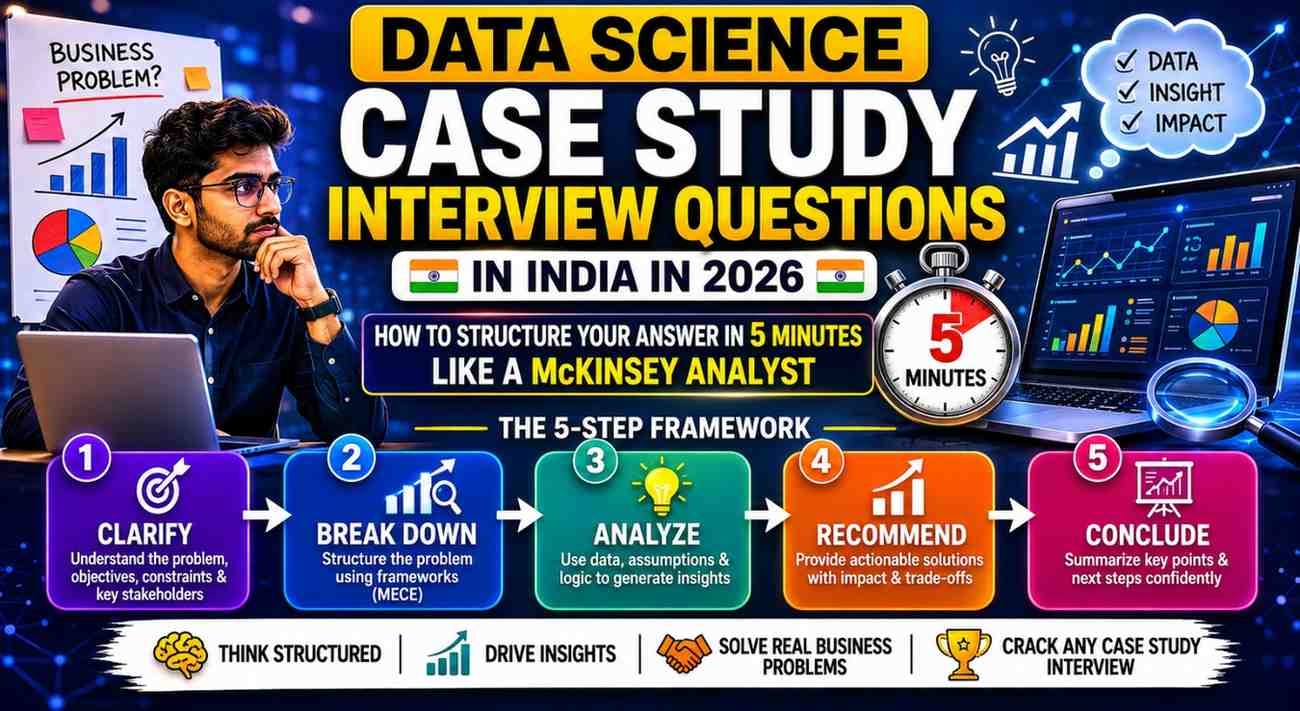
The 5-Step Framework for Answering Any Data Science Case Study
This framework is the foundation for answering every category of data science case study interview questions in India 2026 you will encounter. Memorize it and practice it until it becomes automatic.
Step 1 — Clarify and Scope (60 seconds)
Ask 2–3 clarifying questions before saying a single thing about approach. This shows structured thinking and prevents you from solving the wrong problem.
Questions to ask:
- “What is the primary business objective here — revenue growth, cost reduction, or retention improvement?”
- “What does success look like? What metric would we use to measure it?”
- “What data is available? What are the time and resource constraints?”
Step 2 — Structure the Problem (60 seconds)
Break the problem into 3–4 subcomponents. Use a MECE (mutually exclusive, collectively exhaustive) framework:
“I would approach this in three parts: first, understand the current state through data; then, identify the root cause; then, design and test a solution.”
Step 3 — Define Metrics and Data Requirements (60 seconds)
Before proposing analysis, specify:
- Which metrics matter for this problem
- What data you need and where it might come from
- What the success criteria for your analysis looks like
Step 4 — Propose the Analytical Approach (90 seconds)
Describe your technical solution clearly:
- What analysis or model would you use?
- How would you validate it?
- What are the potential limitations?
Step 5 — Communicate the Business Recommendation (30 seconds)
End with a clear, actionable recommendation:
- What should the company do based on your analysis?
- What is the expected impact?
- What would you monitor going forward?
Applying this framework consistently is what distinguishes great answers to data science case study interview questions India 2026 from average ones.
15 Real Data Science Case Study Questions With Structured Answers
Case Study 1 — E-commerce Growth
Question: Daily active users on Flipkart’s app dropped 25% last week. How would you investigate and fix this?
Structured Answer:
Clarify: Is this affecting all user segments or a specific cohort? Is it across all platforms (Android, iOS, and web) or one? Did any deployment or marketing change happen last week?
Structure the problem:
- Validate the data and measurement (is the drop real or a tracking bug?)
- Segment and isolate the drop
- Identify root cause
- Recommend action
Metrics: DAU, session starts, crash rate, app store rating, notification open rate, login success rate
Analytical approach:
- First check if it is a data pipeline issue — query raw event logs to verify
- Segment DAU drop by platform, geography, user age cohort, acquisition channel
- Check if new users vs returning users are dropping differently
- Run funnel analysis: which step shows the most drop-off?
- Correlate with deployment timeline using a difference-in-differences approach
Recommendation: If it is a crash on Android 14+ after a recent app update, roll back the update immediately and fix it before redeploying. If it is a specific user cohort, investigate their journey and address friction points.
This step-by-step diagnostic is the expected pattern for data science case study interview questions India 2026 at product companies.
Case Study 2 — Recommendation System
Question: How would you build a product recommendation system for Amazon India?
Structured Answer:
Clarify: What is the goal — increase click-through rate, add-to-cart rate, or order value? Are we building for the home page, product page, or cart?
Structure:
- Define the recommendation objective and metric
- Choose the modelling approach
- Define features and training data
- Evaluate and deploy
Metrics: Click-through rate (CTR), add-to-cart rate, conversion rate, revenue per recommendation
Analytical approach:
- Start with collaborative filtering — “users who bought this also bought that”
- Build item-item similarity using cosine similarity on purchase history
- Add content-based filtering using product attributes (category, price range, brand)
- Implement a hybrid model combining both approaches
- Use A/B testing to compare recommendation algorithm performance
Recommendation: Deploy a hybrid model with collaborative filtering as the primary signal. Evaluate using offline metrics (precision@K and recall@K) and online A/B tests targeting CTR improvement.
Case Study 3 — Customer Churn Prediction
Question: Build a customer churn prediction model for a Jio prepaid mobile subscription service. **
Structured Answer:
Clarify: How is “churn” defined—missed recharge for 30 days? What is the timeline for intervention—how far in advance do we need to predict?
Structure:
- Define “churn” precisely
- Identify predictive features
- Build and evaluate the model
- Design the intervention strategy
Metrics to predict: Probability of churn within next 30 days Success metric for the model: Recall (catching as many churners as possible) balanced with Precision (not wasting retention budget on non-churners)
Key features to engineer:
- Days since last recharge
- Average recharge frequency (last 90 days)
- Change in data usage (last 30 days vs previous 30 days)
- Number of customer service calls in last 30 days
- Recharge amount trend (declining = churn signal)
Model choice: Logistic regression as a baseline, Random Forest or XGBoost for production, and explain predictions using SHAP values
Recommendation: Flag top 10% high-risk customers daily. Trigger personalized SMS/WhatsApp recharge offers with a cashback incentive 7 days before the predicted churn date.
This end-to-end business framing is what separates excellent from average answers to data science case study interview questions in India in 2026.
Case Study 4 — Pricing Strategy
Question: Swiggy wants to optimize its delivery fee pricing. How would you approach this analytically?
Structured Answer:
Clarify: Is the goal to maximize revenue, order volume, or customer satisfaction? Are we testing different pricing for different segments or one universal change?
Structure:
- Understand current pricing impact on behaviour
- Model price elasticity
- Design and run a pricing experiment
- Implement and monitor
Analytical approach:
- Analyze historical data: How does order conversion rate change at different delivery fee levels?
- Build a price elasticity model: % change in orders per % change in delivery fee
- Segment elasticity by user type (new vs loyal), order size, time of day, and geography
- Run a geo-based or user-based A/B test with different fee structures
- Measure: order volume, cart abandonment rate, revenue per order, customer LTV
Recommendation: Lower delivery fees for high-value orders (₹400+ cart value) to increase conversion. Maintain or increase fees for small orders where the margin is thin. Test premium delivery tiers (₹29 for 20 min vs. ₹0 for 45 min).
Case Study 5 — A/B Testing
Question: How would you design an A/B test to measure the impact of a new product page layout on Myntra?
Structured Answer:
Clarify: What specific change is being tested? What metric are we optimizing? How long will the test run?
Structure: Experiment design → Statistical framework → Analysis → Decision
Step 1 — Define metrics:
- Primary: Add-to-cart rate
- Secondary: Time on page, wishlist rate
- Guardrail: Bounce rate, page load time
Step 2 — Sample size calculation: Use power analysis to determine the minimum sample size needed to detect the expected effect size with 80% power and 5% significance level. In Python:
python
from statsmodels.stats.power import TTestPower
analysis = TTestPower()
sample_size = analysis.solve_power(
    effect_size=0.1,   # 10% expected improvement
    alpha=0.05,        # significance level
    power=0.8          # statistical power
)
Step 3—Randomization: Randomly assign users (not sessions) to control (50%) and treatment (50%) groups. Ensure no contamination between groups.
Step 4 — Analysis: After collecting sufficient data, run a two-sample t-test or chi-square test depending on the metric type. Accept the new design if p < 0.05 and the effect is practically significant (not just statistically significant).
Case Study 6 — Fraud Detection
Question: PhonePe is seeing a rise in fraudulent UPI transactions. How would you build a fraud detection system?
Structured Answer:
Clarify: What type of fraud—account takeover, stolen credentials, or merchant fraud? What is the tolerance for false positives (blocking legitimate transactions)?
Structure: Data collection → Feature engineering → Model → Real-time scoring → Feedback loop
Key features:
- Transaction amount vs customer’s historical average
- Transaction velocity (multiple transactions in short window)
- Unusual geographic location (IP or GPS mismatch)
- New device or changed device fingerprint
- Time of transaction (3–5 AM = higher risk)
Model choice: Gradient Boosting (XGBoost or LightGBM) for high precision; Isolation Forest for unsupervised anomaly detection: Real-time scoring requires model latency < 100 ms.
Recommendation: Score every transaction in real-time. Flag scores above 0.85 for immediate block + OTP re-verification. Score 0.6–0.85: add friction (extra OTP). Below 0.6: approve automatically.
Case Study 7 — Cohort Analysis
Question: How would you measure whether a new onboarding flow for Zepto customers improves long-term retention?
Structured Answer:
Clarify: What counts as “retained”? Ordering at least once in a 30-day period? What is the intervention—the new onboarding is shown to new signups after a specific date?
Approach:
- Identify pre-intervention cohort (new users from 3 months before launch)
- Identify post-intervention cohort (new users after launch)
- Build week-by-week retention curves for both cohorts
- Compare 30-day, 60-day, and 90-day retention rates
- Control for confounding variables (seasonality, marketing spend) using difference-in-differences
Expected output: Cohort retention chart showing whether Week 4 retention improved from 25% to 35% — a 40% relative improvement that would represent a major business win.
Case Study 8 — Feature Importance
Question: You built a model to predict loan defaults for an NBFC. How do you explain which features drive the predictions?
Structured Answer:
Use SHAP (SHapley Additive exPlanations) values for model interpretability:
python
import shap
explainer = shap.TreeExplainer(model)
shap_values = explainer.shap_values(X_test)
shap.summary_plot(shap_values, X_test)
Key features to highlight in an NBFC context:
- Credit utilisation ratio (most predictive)
- Payment delay history (recency, frequency, severity)
- Debt-to-income ratio
- Number of recent hard enquiries
- Employment tenure and type
Business recommendation: The top 3 features drive 70% of prediction power. Use these as a simplified scorecard for faster manual review of borderline cases.
7 More Common Case Study Questions — Quick Framework Responses
Q 9. How would you reduce food waste at Zomato? → Predict demand by restaurant, day-of-week, and weather. Build a supply recommendation engine. Test with pilot restaurants.
Q10. How would you measure the ROI of a ₹50 crore marketing campaign at Tata Motors? → Incremental sales lift using matched market test. Compare sales in markets with and without campaigns. Use regression discontinuity if the rollout was phased.
Q11. A new feature on CRED has low adoption. How do you investigate? → Funnel analysis from feature awareness to activation. User interviews + in-app survey. Check if the feature solves a real user pain point.
Q12. How would you segment customers for a D2C brand? → RFM analysis (Recency, Frequency, Monetary value) + K-means clustering. Assign each segment a strategy (reward top customers, reactivate lapsed ones).
Q13. How do you measure the impact of a content creator on a short-video app? → Holdout experiment: randomly remove creator’s content from a subset of users’ feeds. Measure DAU, session length, and retention in holdout vs. control.
Q14. Should Ola expand into Tier 3 cities? → Compare CAC, LTV, and ride frequency data from Tier 2 expansions. Model Tier 3 TAM. Simulate unit economics under 3 scenarios. Recommend if IRR exceeds hurdle rate.
Q15. How would you prioritize which data product to build next? → Score each option on 3 dimensions: business impact (revenue/cost), feasibility (data availability, time to build), and strategic alignment. Use a weighted scoring matrix to rank.
Comparison: Case Study Expectations by Company Type in India
| Company | Depth Expected | Technical Expectation | Business Framing |
|---|---|---|---|
| McKinsey / BCG Gamma | Very High | High | Very High |
| Amazon / Flipkart | High | Very High | High |
| Swiggy / Zomato / Zepto | High | High | High |
| TCS / Infosys (Analytics) | Medium | Medium | Medium |
| BFSI (HDFC, ICICI) | High | Medium–High | Very High |
Image Suggestions
Image 1—Placement: After the introduction, a confident Indian data science candidate is at a whiteboard sketching an analytical framework during a case interview in a modern office. ALT text: “data science case study interview questions India 2026 — analyst structuring case study answer on whiteboard during interview”
Image 2 — Placement: After the 5-step framework A clean diagram of the 5-step case study framework with boxes and arrows on a light background, clearly labelled with each step. ALT text: “data science case study interview questions India 2026 — 5-step structured framework for answering case study questions”
External Authority Links
- McKinsey & Company — Analytics Careers India — consulting analytics career paths and expectations
- BCG Gamma — Data Science India — advanced analytics case study examples
- Analytics Vidhya — Case Study Practice India — India’s largest data science community
- Towards Data Science — Case Study Frameworks — expert data science case study guides
- Glassdoor India — Data Science Interview Experiences — real candidate experiences at Indian companies
FAQs: Data Science Case Study Interview Questions India 2026
Q1. How long do I get for a data science case study interview in India? Most data science case study interview questions in India’s 2026 rounds give you 20–30 minutes for a single case and 45–60 minutes for a take-home assignment. The 5-step framework in this guide is designed to be completable in 5 minutes for structure + 15–20 minutes for depth.
Q2. Do I need to code during case study interviews? At product companies (Amazon, Flipkart, Swiggy), some data science case study interview questions in India 2026 rounds involve whiteboards or pseudocode. At consulting firms (McKinsey, BCG Gamma), the focus is on business reasoning and structured thinking—coding is usually in a separate technical round.
Q3. What is the most common mistake in data science case study interviews in India? Jumping to technical solutions (suggesting a neural network) without first defining the business objective, success metric, and data requirements. Every strong answer to data science case study interview questions in India 2026 starts with clarifying questions, not solution proposals.
Q4. How do I practice for data science case study rounds in India? Practice the 5-step framework on every case in this guide until it is automatic. Then find case studies on Analytics Vidhya, Towards Data Science, and Glassdoor India. Do mock interviews with peers. Real practice with feedback is the fastest way to master data science case study interview questions in India in 2026.
Q5. Is domain knowledge important for data science case studies in India? Yes, interviewers at BFSI companies expect knowledge of credit risk and fraud patterns. E-commerce companies expect familiarity with funnel metrics and retention. Tailoring your data science case study interview questions for 2026 India preparation to your target industry significantly improves your performance.
Conclusion
Mastering data science case study interview questions in India in 2026 is about developing a repeatable thinking framework, not memorizing answers. The 5-step structure in this guide—clarify, structure, define metrics, propose approach, and recommend action—works for every business problem you will encounter.
Practice applying this framework to every case study in this guide until structured thinking becomes your natural reflex. Read business news about your target company. Understand their metrics, their user base, and their strategic challenges. That combination of framework fluency and business context is what makes the difference between a candidate who “answered the question” and a candidate who gets the offer.
Which case study type feels hardest for you? Share it in the comments, and we will walk through a detailed structured answer together!